Mean variance and 1/N heuristic portfolio

As a next step, as non-expert of portfolio management, i found interesting books and papers making different use of the nobel-prize Markowitz strategy, AKA mean-variance portfolio https://en.wikipedia.org/wiki/Markowitz_model (MPT Modern Portfolio Theory) applied to 10 common stocks from the Nasdaq100.

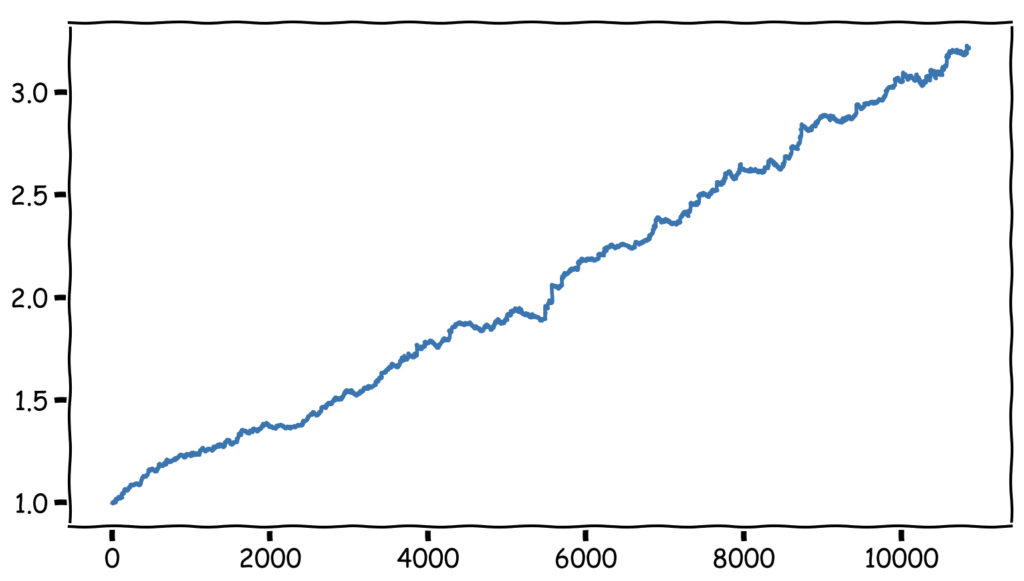
The applied algorithm doesn’t allow for trades at every timeframe (15m, hour, day) thus some theories cannot be applied (e.g. fixed allocation, long strategy, etc.), however the best portfolio and weights with lowest risk that was found brought to a CAGR = 0.5402, SHARPE RATIO = 9.5759, MAX DRAWDOWN = 2,6948%.

Mean Variance Portfolio

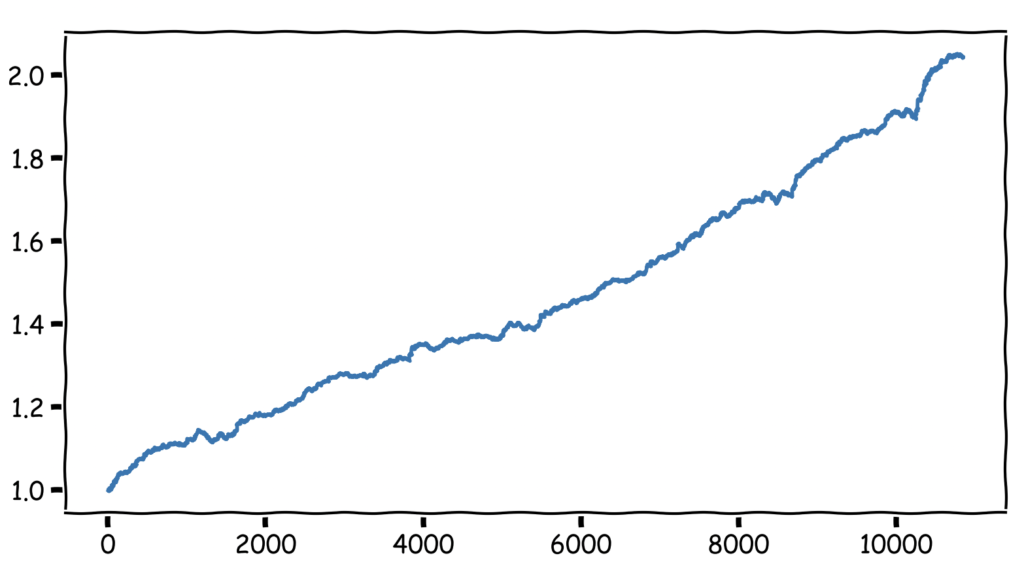
A different approach would be to apply the 1/N heuristic that is a simple investment strategy where an investor allocates an equal proportion of their total capital across N assets. It offers some advantages, that is it simple and it may reduce the unsystematic risk associated with individual asset (it is not guaranteed that past behavior will be the same as future behavior), but it’s not optimal in terms of risk-adjusted return since it treats all assets equally, regardless of their risk/return characteristics.

The underlying selection follows a fast and frugal approach that is selecting first the underlying with acceptable risk (e.g. Max Drawdown) and then picking the 10 best performing. Resulting CAGR = 1.0249, SHARPE RATIO = 10.0465, MAX DRAWDOWN = 3,2248%

1/N Heuristic Approach

Multislot Performance Example

In algorithmic trading platforms, “multislot” refers to the system’s ability to manage multiple trading algorithms or strategies simultaneously. Each “slot” represents a distinct strategy or trading approach, allowing the system to execute several strategies in parallel. This capability enhances both optimization and diversification, as the system can apply these strategies within the same market or across different markets, assets, or trading techniques. Essentially, “multislot” allows the system to handle multiple orders at the same time. For example, a trader could place various orders to buy or sell different assets in varying quantities, each with specific execution criteria (e.g., market orders, limit orders). All of these are managed concurrently by the trading system.

In this example, we’ll make some assumptions:

  • The underlying assets are high-volume stocks, selected blue-chip companies (e.g., AAPL, ADBE, AMD, AMZN, CSCO, GOOG, INTC, MRVL, MSFT, NVDA, TSLA);
  • The algorithms demonstrate an average accuracy of 57%. For this simulation, the trading signals are selected randomly;
  • The trading strategy is straightforward: positions are either long or short, with positions opened at the market open and closed at the market close;
  • Each slot has a fixed capital allocation of $10,000;
  • Lever is equal to 1.

The results of the simulation is shown in the previous figure.

Deductions from gross gains should be applied and include:

  • Trading fees: Assume $2 per transaction. Given 250 trading days, this would result in an annual trading fee of $1,000 per underlying;
  • Taxes: Tax liabilities can vary significantly depending on the country;
  • Market volatility: Since this is a long/short strategy, we assume that the volatility at the open and close of the market will often cancel out, meaning any movement in one direction will likely be balanced by the opposite movement, resulting in a net sum of zero.

(Image: Photo of Coinstash from Pixabay)